Institutions
Back
Fourth Quarter | 2019
Download (PDF 194 KB)
((Includes Q4 2019 Performance Overview))

President’s message

The start of a new year is always a good time for reflection, and this year perhaps even more so as we move into the next decade. As I think back on the last 10 years, there have been many significant developments from a global perspective: the longest bull market in history; Apple unveiling the first iPad; Trump elected U.S. President (and impeached); the surge of Bitcoin; Twitter, Facebook, and Alibaba going public; unprecedented monetary policy intervention from central banks; Brexit; trade tensions between the U.S and China; protests in Hong Kong; and the list goes on.

From a firm perspective, we have also seen many significant developments over the past decade: we launched three new funds (Global Balanced Fund, Global Bond Fund, and the Emerging Markets Equity Fund); our assets under management increased from $6.7 billion to over $64 billion; the Balanced Fund (Series A) delivered an annualized 10-yr return of 9.3%; we moved office locations in Calgary and established offices in Toronto and Singapore; as a firm we donated over $5 million to communities; and we made the decision to remain an independent firm.

Although the firm has experienced significant change over the past decade, I’m most struck by what has stayed the same—our firm’s core values: act with integrity, put clients’ interests first, pursue excellence, work as a team, and think long-term. It is our continued commitment to these values that has made us the firm we are today and the firm we will be in the future. On behalf of everyone at Mawer, I want to thank you for putting your trust in us. We know that you have a choice of investment managers and we are honoured and humbled by your ongoing support.

We wish you all a very Happy New Year,

Craig Senyk

Market overview

What a stark contrast a year brings. A year ago, in the fourth quarter of 2018, we were in the midst of a sudden, sharp market decline. Interest rates were rising, parts of the yield curve had inverted, and fears of a global recession were rampant. Uncertainty abounded, most notably with respect to the future path of interest rates, U.S./China trade negotiations, and Brexit.

This year, the fourth quarter of 2019 closed with a risk-on rally in which risky assets globally capped off a remarkable comeback. The shift in investor psychology that began in early 2019 with central banks’ recommitment to lower interest rates further improved in Q4 as some of the uncertainty investors had been worried about was removed: negotiations between the U.S. and China appear to be progressing, the Conservatives’ decisive victory in the U.K. gave Brexit clarity, and, closer to home, the results of the Canadian election largely signalled “business as usual.”

Fortunately, we don’t aggressively position portfolios for one particular outcome, but instead view the world in a probabilistic way, remaining mindful that many different outcomes, both positive and negative, may unfold. Looking back a year ago, as the odds worsened, we did shift to a more defensive stance. At the asset mix level, we trimmed equity and increased cash and bonds in our balanced portfolios. Within our various equity funds, we re-allocated capital towards more defensive or resilient businesses. But the magnitude of these changes was modest, and clients were still well- positioned to benefit from a year that unfolded better than most expected. 2019 returns for our balanced funds were solidly double-digit with strong relative returns across numerous asset classes. Investors who went ultra-defensive missed this opportunity.

This isn’t the only way to invest. Others do make more aggressive moves to position for one outcome over another. It’s great when it works. Not great when it fails. Since we don’t believe our edge is to consistently forecast macro events or inflection points in a cycle, we’ll continue to make modest portfolio adjustments as events unfold.

How did we do?

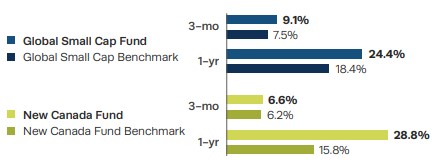
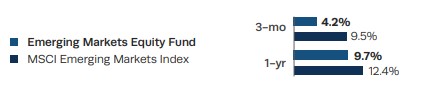
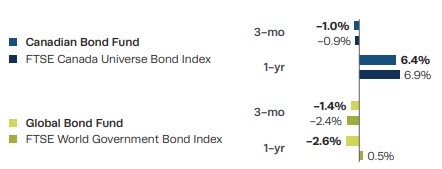
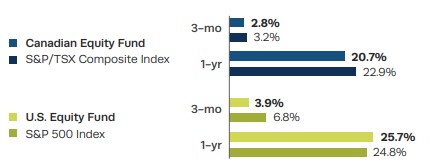
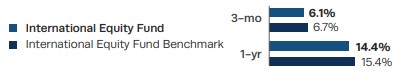
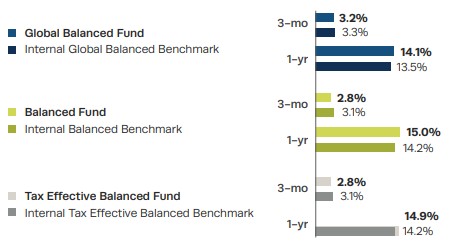
Performance has been presented for the A-Series Mawer Mutual Funds in Canadian dollars and calculated net of fees for the 3 month period of October 1 – December 31, 2019, and 1 year.

Our small-cap strategies had strong years versus their benchmarks, capped off by solid returns in the fourth quarter with many of our top-weighted positions delivering stellar returns (Boyd Group, Enghouse, Softcat, Bechtle, Diploma). Of note, investors had a euphoric reaction to results released by contact centre management software provider Enghouse during the quarter. The results provided evidence for one of the critical elements of our investment thesis: a management team that can allocate capital effectively.

Enghouse invested in a new ERP system two years ago that they claimed would allow them to integrate acquisitions more effectively. Sure enough, after having recently acquired two sizable but unprofitable software businesses, Enghouse reported that they had raised EBITDA margins in both businesses close to the company average of 31% in less than a year—an impressive achievement.

Value-added resellers Softcat and Bechtle also delivered strong results and growth predicated on their clients’ need for help in navigating increasingly complex IT and security requirements. These are business models we like, in part because they are capital-light. We generally try to avoid tech companies that compete by throwing capital at problems in favour of those that deliver advice. Though we have been trimming them to manage their weights, Softcat and Bechtle remain top holdings in our global small cap strategy, and we have added a number of IT consulting firms over the past six months to our other portfolios (Accenture, CGI, Nomura Research Institute).

During such a risk-on quarter, it was no surprise that emerging markets stocks were among the best performers globally. Generally speaking, given our “be boring” approach, such bull markets are not those in which we would expect our emerging markets strategy to keep up. Steady-eddy portfolio holdings like S-1 Corporation, South Korea’s largest alarm security service provider, and ADDCN Technologies, a provider of online marketplaces in Taiwan, lagged more cyclical businesses in the benchmark. Notably, the portfolio has less exposure to Chinese equities, clear beneficiaries from any progress on trade.

And while it was risk-on globally, there were pockets of the world that exhibited challenges. Social unrest in Chile impacted our investments in the country’s leading beverage distributor Compania Cervecerias Unidas, and liquified petroleum gas distributor Empresas Lipigas. Several of our holdings in India traded lower in conjunction with a domestic economic slowdown. In the end, our emerging markets portfolio’s return— though positive—fell well short of its benchmark.

Further evidence of the risk-on nature of Q4 was the fact that bond yields rose leading to negative performance from bonds. But keep in mind that a focus on merely the last three months is myopic: in 2019, Canadian bonds delivered returns well-in excess of their yields given the environment of falling yields that prevailed in the earlier part of the year. And given the strength of the Canadian dollar over the year—a risk-on currency itself—it is unsurprising for our unhedged global bond strategy to have lagged domestic bonds in Canadian dollar terms.

Elsewhere, some of our YTD leaders took a breather in the fourth quarter as more defensive names tend to lag in an upbeat market. In Canada, Loblaw fits this description; we continue to like the company’s position as the largest food and drug retailer in Canada. Though our U.S. equity strategy had a strong year versus its benchmark, recent stalwarts Verisk and Hershey drifted lower in Q4 after hitting all-time highs in September. These are defensive, stable-demand businesses. Verisk supplies data/info to the insurance industry that insurers depend on to price their policies. Verisk’s services make up a low percentage of their customers’ total costs and yet they are completely embedded into their customers’ processes—in other words mission critical with high switching costs. We continue to view Verisk as having an excellent business model; admittedly, it is priced as such.

Conversely, some of our YTD underperformers bounced back in Q4 as headwinds receded. As a German industrial lubricants manufacturer with a big chunk of its client-base in the auto sector, Fuchs Petrolub was in the eye of the hurricane earlier in the year given the macro backdrop of slowing global growth, trade tensions, and reduced auto demand from China. As some of these clouds have lifted, the stock has come back. Though the nature of its business doesn’t make a company like Fuchs immune from such pressures—it is certainly cyclical—the fact that its balance sheet is net cash (no debt) gives us comfort that it will survive through tough times.

Overall, it was a fantastic year for balanced investors— one in which more globally-oriented portfolios underperformed those with higher Canadian content given the strength of the pro-cyclical Canadian dollar and stock market.

Looking ahead

We are tasked with investing in an ever-present environment of uncertainty. As we exit the decade, and look towards 2020, the following appear to be the most prominent uncertainties on our radar: slowing economic growth; the depth and velocity of technological change; the impact of low interest rates; and investor psychology.

Global trade disruptions over the past few years have certainly played their part in driving slower economic growth. While markets appear to be moving on optimism for détente between the U.S. and China, we have been in this position before and there is no guarantee trade talks will ultimately reach a smooth resolution. Adding to the uncertainty is the knowledge we have been in a global economic expansion for over 10 years: that alone might give us pause. Whether the current slowdown is simply a normal part of a typical business cycle or the signalling of something greater, is yet to be seen.

Second is the depth and velocity of technological change. Undisputedly, technology continues to grow in economic importance. For example, as of September 2019, China’s top-ranked annual import was integrated circuits (or microchips) valued at $312B USD, greater than crude oil coming in at $239B USD!

The widely anticipated hope of further technological advancements that provide the capability to do more, in a smarter and faster way, also has the effect of producing new economic models that could possibly sustain global economic growth for longer. And while we see this as a positive for world economies, advancements in technology also offer a partial explanation behind the low inflationary environment we have been experiencing for some time: technology improves efficiencies and reduces consumption; it facilitates transparency and therefore competitive pricing, and; the faster it enters the market, the cheaper it gets.

Third, we are keeping a careful watch over the uncertainty around experimental monetary policy and the impact low interest rates may have over the long- term. Essential to this issue is the idea that it’s hard to diversify away from interest rates. Any asset that is valued based off of future cash flows has interest rate risk. Not just bonds, also equities; and just like bonds, different stocks can have different sensitivities.

We are consistent in communicating that we don’t think we can predict the future. Our approach is to think probabilistically about potential outcomes and test our assumptions and those of the management teams we interview through scenario analysis. We have checks and balances to ensure we are positioned for a wide range of outcomes.

And finally, is investor psychology. We would caution that it is unlikely for your portfolio’s return in 2020 to match what it achieved in 2019. From a valuation perspective, there is a higher degree of risk in the portfolio today versus a year ago: in aggregate, the increase in our underlying companies’ free cash flow per share has not increased as much as the portfolio’s mark-to-market value over the past year. And we know that investor psychology can be fickle.

That said, while some of our recent activity can be characterized as having high-graded our portfolios at opportunistic entry/exit points, the vast majority of lower-valued securities in the world fail in some way to meet the three tenets of our investment philosophy: companies that can sustainably earn a return on invested capital greater than their cost of capital, that are effectively managed, and that trade at a discount to their intrinsic value.

As such, though we acknowledge that valuation has become less attractive, we continue to believe that a portfolio of genuinely wealth-creating businesses remains a prudent approach for investors looking to protect and compound capital over long periods of time. That is our way of executing on keeping your investment experience “boring.” While the next decade will bring its share of uncertainty, we’re unlikely to change our disciplined and time-tested approach.

Disclaimer

Non-performance related material in this document reflects the opinions of the writer, and does not reflect fact or predictions of actual events or impacts, and cannot be relied upon for investing purposes or as investment advice or guarantees of any kind.

Index returns are supplied by a third party—we believe the data to be accurate, however, cannot guarantee its accuracy.

This document is for information purposes only. Before investing, please consult the simplified prospectus, available at www.sedar.com, and the Fund Facts. Mutual funds are not guaranteed, their values change frequently, and past performance is not indicative of future performance. Commissions, trailing commissions, management fees and expenses all may be associated with mutual fund investments. (Mutual fund securities are not covered by the Canada Deposit Insurance Corporation or by any other government deposit insurer. There can be no assurances that the fund will be able to maintain its net asset value per share at a constant amount or that the full amount of your investment in the fund will be returned to you.)

Performance returns for the Mawer Mutual Funds are calculated by Mawer Investment Management Ltd. These returns are historical simple returns for the 3 month, YTD and 1 year periods, and annualized compounded total returns for periods after 1 year. They include changes in unit value and reinvestment of all distributions and do not take into account sales, redemption, distribution or optional charges or income taxes payable by any security holder that would have reduced returns.

This Mawer Quarterly includes certain statements that are “forward looking statements”. All statements, other than statements of historical fact, included in this report that address activities, events or developments that the portfolio advisor, Mawer Investment Management Ltd., expects or anticipates will or may occur in the future, including such things as anticipated financial performance, are forward looking statements. The words “may”, “could”, “would”, “should”, “believe”, “plan”, “anticipate”, “expect”, “intend”, “forecast”, “objective” and similar expressions are intended to identify forward looking statements. These forward looking statements are subject to various risks and uncertainties, including the risks described in the Simplified Prospectus of the Fund, uncertainties and assumptions about the Fund, capital markets and economic factors, which could cause actual financial performance and expectations to differ materially from the anticipated performance or other expectations expressed. Economic factors include, but are not limited to, general economic, political and market factors in North America and internationally, interest and foreign exchange rates, global equity and capital markets, business competition, technological change, changes in government regulations, unexpected judicial or regulatory proceedings, and catastrophic events.

All opinions contained in forward looking statements are subject to change without notice and are provided in good faith but without legal responsibility. The portfolio advisor has no specific intention of updating any forward looking statements whether as a result of new information, future events or otherwise, except as required by securities legislation. Certain research and information about specific holdings in the Fund, including any opinion, is based upon various sources believed to be reliable, but it cannot be guaranteed to be current, accurate or complete. It is for information only, and is subject to change without notice.

The MSCI information may only be used for your internal use, may not be reproduced or disseminated in any form and may not be used as a basis for or a component of any financial instruments or products or indices. None of the MSCI information is intended to constitute investment advice or a recommendation to make (or refrain from making) any kind of investment decision and may not be relied on as such. Historical data and analysis should not be taken as an indication or guarantee of any future performance analysis, forecast or prediction. The MSCI information is provided on an “as is” basis and the user of this information assumes the entire risk of any use made of this information. MSCI, each of its affiliates and each other person involved in or related to compiling, computing or creating any MSCI information (collectively, the “MSCI Parties”) expressly disclaims all warranties (including, without limitation, any warranties of originality, accuracy, completeness, timeliness, non-infringement, merchantability and fitness for a particular purpose) with respect to this information. Without limiting any of the foregoing, in no event shall any MSCI Party have any liability for any direct, indirect, special, incidental, punitive, consequential (including, without limitation, lost profits) or any other damages. (www.msci.com)

London Stock Exchange Group plc and its group undertakings (collectively, the “LSE Group”). © LSE Group 2019. FTSE Russell is a trading name of certain of the LSE Group companies. FTSE® is a trade mark(s) of the relevant LSE Group companies and is/are used by any other LSE Group company under license. “TMX®” is a trade mark of TSX, Inc. and used by the LSE Group under license. All rights in the FTSE Russell indexes or data vest in the relevant LSE Group company which owns the index or the data. Neither LSE Group nor its licensors accept any liability for any errors or omissions in the indexes or data and no party may rely on any indexes or data contained in this communication. No further distribution of data from the LSE Group is permitted without the relevant LSE Group company’s express written consent. The LSE Group does not promote, sponsor or endorse the content of this communication.