


 blog

The 10-year U.S. Treasury yield crossed 5% in mid-September, its highest level since 2007, and it kept climbing. By late September it had reached 5.12%, and the 30-year yield hit 5.47%, a level last seen in 2004. It has since settled just above 5% more recently after starting the year near 4.17%.
Treasury yields influence borrowing costs throughout the economy, from mortgages and corporate debt to the interest the U.S. government pays on more than $40 trillion of debt, which now runs around $3 billion a day.1
Clients have been asking what this means and whether 5% is a threshold to worry about. We don’t think the number tells you much on its own. Why the yield moved matters more, and on that, economists and market commentators disagree.
How yields got here
The path to 5% hasn’t been a straight line. The 10-year dipped to just under 4% in late February, right before the U.S. launched strikes on Iran. The war limited oil-tanker traffic through the Strait of Hormuz and pushed oil prices and inflation higher. Yields climbed through the summer. In August the Treasury unexpectedly doubled its bond buyback program to calm the market, which worked only briefly. By mid-September the 10-year had crossed 5%, the same week the Federal Reserve raised rates for the first time in three years under its new chair, Kevin Warsh.
Why yields have risen
A Treasury yield has little default risk in it, so it mostly reflects three things: what investors expect from inflation and from the Fed, the extra pay they want for lending for a long time, and how many bonds are competing for their money. Right now, several of these look to be moving at once.
The simplest explanation is that the economy is running hot, inflation is sticky, and investors expect the Fed to keep rates higher for longer. The Wall Street Journal’s James Mackintosh split the 10-year yield into expected inflation and the real, inflation-adjusted rate. Expected inflation barely moved. Most of the rise came from the real rate, which means investors want a higher return even after allowing for inflation. That suggests investors still trust the Fed’s 2% target and think it will take higher rates to get there.2 Fed funds futures tell the same story. In January they implied the Fed’s rate peaking near 3% by October 2027. Now it’s closer to 4.75%.
Chart 1. Higher real yields have done most of the work
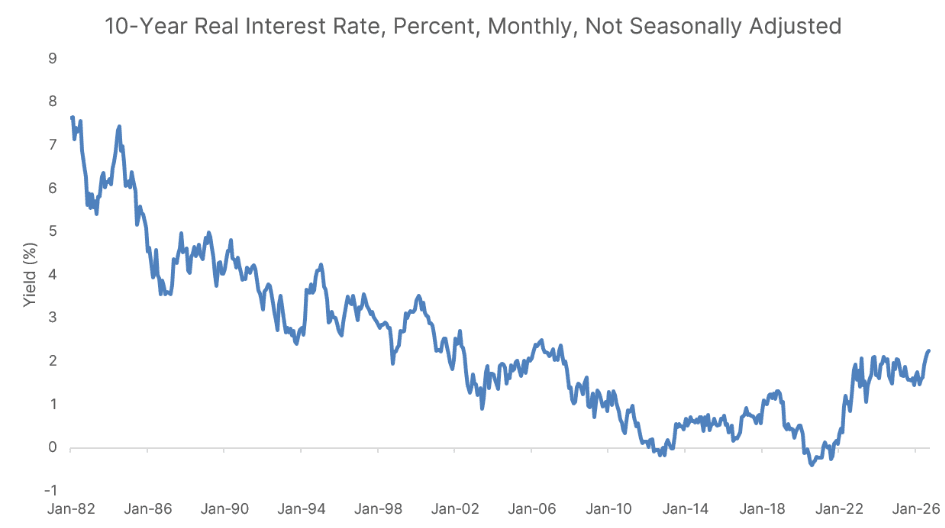
Source: Federal Reserve Board and Federal Reserve Bank of Cleveland, via FRED. 10-year Treasury yield through October 8, 2026; 10-year real interest rate, monthly, not seasonally adjusted.
Chart 2. US 10-year inflation expectations
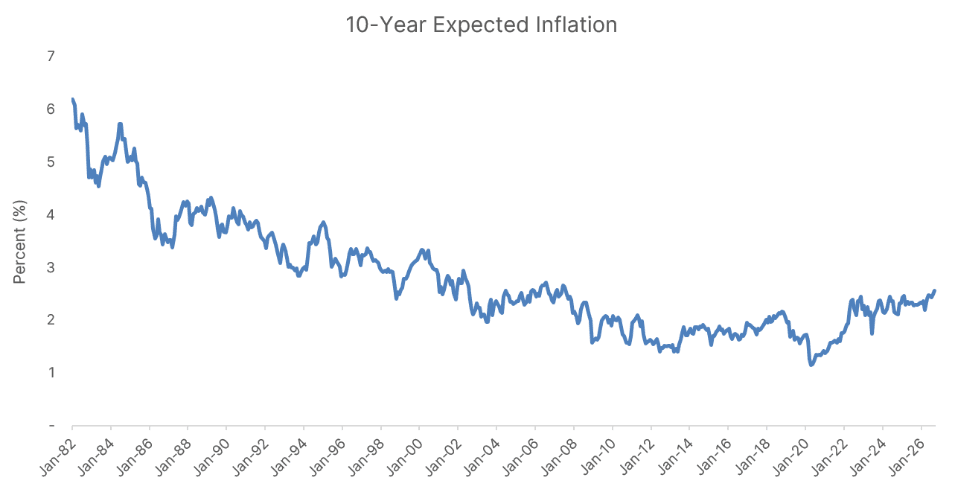
Source: Federal Reserve Bank of Cleveland, via FRED. 10-year expected inflation, monthly, not seasonally adjusted.
A less comfortable explanation is that investors want more compensation for risk. Macquarie’s Viktor Shvets calls the rising term premium, the extra yield investors demand for holding longer-dated bonds, an “insanity premium,” a reflection of policy uncertainty.3 The longer the loan, the more room there is for surprises in inflation or policy to eat into what you get back, so when policy is harder to predict, investors ask for more. Against that, credit-default swaps (insurance against a borrower defaulting) show no real fear of a U.S. default, and inflation breakevens, the market’s forecast for future inflation, have stayed low and stable.4 Still, while higher real rates explain much of the broader increase, a rising term premium appears to have driven the latest move. A New York Fed model shows it surged about 40 basis points from mid-September to roughly 0.98% in early October, its highest since 2014 and more than the 10-year yield’s nearly 30-basis-point rise over the same stretch.5
The third explanation goes back about twenty years. A global savings glut, concentrated in Asia, chased a limited supply of safe government bonds and helped hold yields down. That is reversing. Governments are borrowing more, central banks have stepped back from buying, and foreign demand has weakened. The European Central Bank’s Isabel Schnabel has described it as a move from a savings glut to a bond glut.6
That shift isn’t just a U.S. story. Oaktree’s latest credit outlook notes that government yields have also risen in the UK, Germany, and Japan.7 Yields have climbed in Canada and the eurozone too, as the chart below shows. Each market has its own pressures, but a move this broad points to a global change in the supply of and demand for government debt, not a problem unique to the U.S.
Chart 3. Global bond yields on the rise
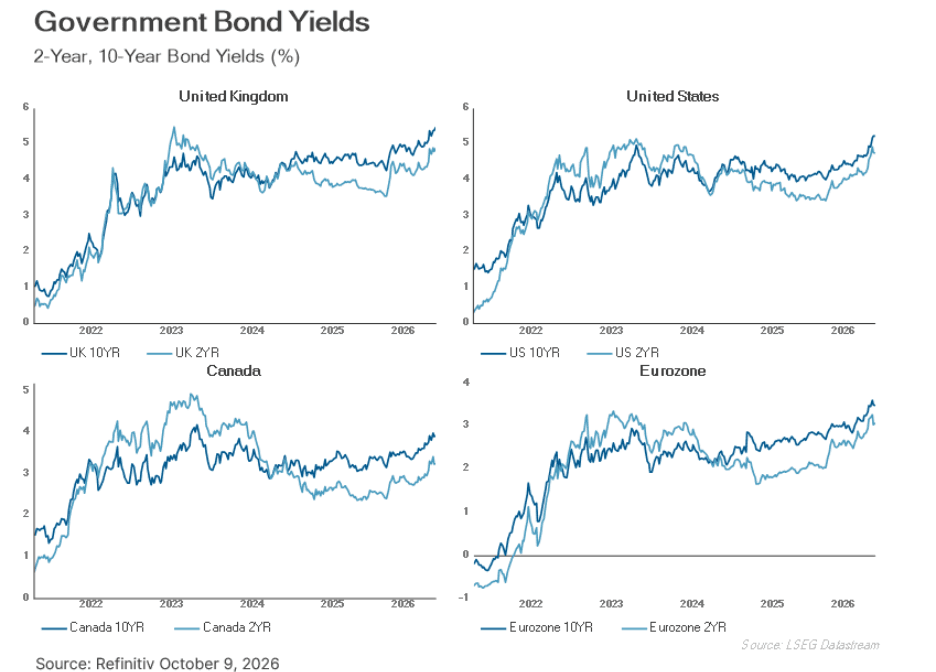
Source: Refinitiv (LSEG Datastream), as of October 9, 2026. 2-year and 10-year government bond yields.
A fourth force, and the newest and most debated, is the borrowing by AI hyperscalers to fund data-center construction. Our credit team notes that investment-grade companies have sold roughly $1.65 trillion of bonds this year to late September, already ahead of all of 2025 and close to the 2020 record, with only a few months still to go.8 Whether that borrowing is crowding out demand for Treasuries is a live question. Paul Moroz, a Mawer portfolio manager, called the scale unprecedented on a recent episode of The Art of Boring and said there could be some crowding out filtering into yields. Morgan Stanley’s Vishwas Patkar sees it differently. The borrowing is coming largely from mega-cap companies with plentiful cash that can issue much more without hurting their credit ratings, he says, so the problem is more one of market capacity: can all this issuance be absorbed?9
So, there’s no single answer here. Our read is that some of all these forces are at work, and maybe others we can’t see yet, weighted differently depending on who you ask. One study of the rise in long-term U.S. rates since 2020, by economists at the Bank of England, the Bank for International Settlements (BIS) and the University of British Columbia, found that narrow windows around Fed speeches and payroll data account for 80 to 90% of the move.10 In other words, what investors expect the Fed to do next may be doing most of the work.
What’s so magic about 5%?
We’re not sure it is. It’s a round number, and round numbers draw attention for reasons that have little to do with what’s happening underneath. Mackintosh’s framing is a useful one: the cause of a yield move matters more than the level it happens to cross.11 A 5% yield driven by a strengthening economy is a different signal from a 5% yield driven by fading confidence in fiscal policy.
The last time yields were this high in 2007, the strain was building quietly in shadow banking and subprime credit before it broke. This time the gauges we can see look calmer. The MOVE index, which tracks expected volatility in the bond market, has jumped but stayed orderly, nothing like the 2020 pandemic selloff or the 2023 Silicon Valley Bank episode, and investment-grade credit spreads have barely moved.12 We’re watching it, and it isn’t a signal either way yet.
Can the U.S. Treasury do anything about it?
The Treasury hasn’t been idle. In August it doubled its bond buyback program, and in September it ran another buyback operation that fell short of its target. Yields rose rather than fell.
Nellie Liang, the Treasury’s under-secretary for domestic finance when the buyback program was reintroduced in 2024, says the tool was built to support market liquidity, and that aiming it at yields instead is a much more activist use. It also isn’t the same as what the Fed can do, because the Treasury can’t create money. Oaktree’s Howard Marks put it more bluntly in a recent client memo: forcing yields down by buying bonds is like a doctor applying an ice pack to a patient with a fever.13 It might bring the temperature down, but the patient doesn’t get healthy until the cause is dealt with.
The debt underneath
Underneath the day-to-day moves is a longer-running question about U.S. public finances. Put simply, it comes down to two rates: the interest rate the government pays on its debt and the growth rate of the economy after inflation. Interest adds to the debt each year, while growth expands the economy that has to carry it. If interest runs ahead of growth, the debt gets harder to stabilize relative to the size of the economy (the debt-to-GDP ratio), especially while the government keeps running deficits. If growth runs ahead, the burden can shrink. This is where rising yields come in: as older debt is refinanced at today’s higher rates, the government’s average interest rate rises, which makes it harder for growth to stay ahead unless the economy accelerates or deficits shrink. Growth stayed ahead for much of the period after the Second World War, helped by two things: interest rates that had been capped by the Fed during and after the war and were released only gradually in the 1950s, and inflation that eroded the real value of the debt. Whether that combination could work again today is an open question.
Carmen Reinhart and Kenneth Rogoff’s research on government debt shows why it gets harder as debt climbs. As debt approaches levels where a country has run into trouble before, investors tend to demand much more extra yield to hold it. At that point, even governments fully committed to repaying can be forced into steep spending cuts or tax increases to keep lenders on side.14
Howard Marks calls the dollar’s reserve status a “golden credit card”: no credit limit, the bill never comes, and the interest rate is extremely low. The trouble, he says, is that the U.S. uses the card unwisely.15 A missed payment is unlikely, since U.S. debt is denominated in a currency the U.S. issues itself. If confidence in U.S. fiscal management keeps eroding, pressure on the dollar is the likelier result. Marks cautions that moving into gold or other non-dollar assets as a hedge brings risks of its own.
Stocks and bonds
When yields rise, a company’s future profits are worth less in today’s dollars. You can see it in the data right now. Stocks have tended to fall on days when yields rise, and that pattern has held more consistently than at any point in almost thirty years. For the first two decades of this century it was the other way around, with stocks and yields rising together as a stronger economy lifted both.
Paul Moroz, who we heard from earlier on crowding out, has also walked through the sensitivity on the same podcast episode. As an illustration, equity duration, the stock-market version of the bond concept, is roughly 15. If nothing else changed, a 1% rise in the rate investors use to discount future profits could mean a decline of about 15% in equity markets. But profits don’t stand still, and growing profits can cancel out some or all of that hit. A decline that size hasn’t happened, and it makes him wonder whether earnings growth has been offsetting shrinking valuation multiples in some cases. Nvidia, for example, trades at only about 13 times next year’s expected earnings, some of the cheapest forward earnings the stock has ever traded at.
What it means for borrowers
In the U.S., mortgage rates and many other long-term borrowing costs track the 10-year yield, so a move like this shows up in monthly payments. The average 30-year fixed mortgage rate is back above 7%, and the housing market is frozen, with moderate new-home sales and existing-home sales at historically low levels.16 In Canada the more relevant benchmark is the 5-year Government of Canada bond, which sets the reference rate for most Canadian mortgages. Anyone renewing a five-year mortgage right now might be in for a shock at how much they’re going to be paying. The pressure won’t fall evenly. Companies with manageable debt and dependable cash flow have more room to absorb higher financing costs. Highly leveraged borrowers have less. Oaktree points to particular strain among companies bought in leveraged buyouts during 2021 and early 2022, when borrowing was cheap and purchase prices were often high.17 For those businesses, more cash going to interest means less available to invest, pay down debt, or withstand a setback.
Not all bad news
Higher yields also help anyone buying bonds now. The yield you start with is the best guide to what a bond held to maturity will earn, so new money goes in at a higher expected return than at the start of the year, when the 10-year was near 4.17%.
There’s an important distinction, though, between a higher yield and better compensation for risk. A corporate bond’s yield includes both the government benchmark and an additional spread for lending to the company. Corporate bond yields are high by recent standards even though average spreads remain historically tight. Investors can earn more income than they could in the low-rate years without necessarily receiving a larger cushion against credit losses.
The same starting-point logic applies to stocks. When yields rise, stock prices tend to fall, and paying a lower price for the same future profits means a higher expected return for new buyers, as long as those profits hold up.
Traditional pension plans fund their promised benefits by buying bonds, so higher yields make that cheaper and lower the risk of a pension crisis. There’s a broader upside, too. After years of cheap money, a higher cost of capital pushes governments and companies to be more disciplined about where they invest, since a project now has to clear a higher bar to be worth funding.
What to watch
So, is 5% a threshold to worry about? On its own, we don’t think so. What matters is what’s behind it: a U.S. economy running warmer than expected, a market asking for more pay for policy uncertainty, fewer buyers of government debt, and corporate borrowers competing for the same capital. We don’t know how much each one matters, and we’d be wary of anyone who says they do. What we’ll be watching is whether the Fed stays as hawkish as markets expect, whether the debt conversation moves back to center stage, and how much more AI borrowing is still to come. Rates will keep moving, and the headlines with them. What matters more over the long run is owning businesses that can earn their way through a higher cost of capital and paying sensible prices for them. That was true when the 10-year was at 4%, and it will be true wherever it goes from here.
1Source: NPR, “The Bond Market Is Signaling Trouble Ahead” (Aug 20, 2026).
2Source: WSJ/Mackintosh, “Why It’s So Hard to Work Out What the Bond Market Is Telling Us” (Sep 20, 2026).
3Source: Bloomberg/Authers, “Bessent Must Envy When the Grownups Were in Charge” (Aug 21, 2026).
4Source: Bloomberg/Authers, “Bessent Must Envy When the Grownups Were in Charge” (Aug 21, 2026).
5Source: Bloomberg, “Wall Street Sees an Ominous Sign in Bond Market’s Latest Selloff” (Oct 9, 2026).
6Source: Bloomberg, “Why Government Bond Yields Are Rising and Causing Alarm” (Sep 1, 2026).
7Source: Oaktree Capital, “Credit Quarterly: New Terms” (2026).
8Source: Mawer GCO Weekly Sheet (internal, Sep 25, 2026).
9Source: Bloomberg/Authers, “Bond Yields Return to 2007, But It Could Be Worse” (Sep 23, 2026).
10Source: CEPR/VoxEU, Beaudry, Cavallino and Willems, “Anatomy of a rise: Monetary policy and the post-Covid surge in long-term interest rates” (Sep 21, 2026).
11Source: WSJ/Mackintosh, “Why It’s So Hard to Work Out What the Bond Market Is Telling Us” (Sep 20, 2026).
12Source: Bloomberg/Authers, “What’s Going to Break in the Bondpocalypse?” (Sep 28, 2026).
13Source: Howard Marks, Oaktree memo, “Shall We Repeal the Laws of Economics – Part III” (Sep 22, 2026).
14Source: NBER Working Paper 15639, Reinhart and Rogoff, “Growth in a Time of Debt” (Jan 2010).
15Source: Howard Marks, Oaktree memo, “Shall We Repeal the Laws of Economics – Part III” (Sep 22, 2026).
16Source: Bloomberg/Authers, “Bond Yields Return to 2007, But It Could Be Worse” (Sep 23, 2026); FT Unhedged (Sep 10, 2026).
17Source: Oaktree Capital, “Credit Quarterly: New Terms” (2026).